If someone uses Pluto+ or a hacked PlutoSDR that has been extended with a second RX input, I recommend the following modified mrc100_pluto_rx program. This utilizes both inputs of Pluto+ and creates separate *.cf32 files from the signals on the two receiver inputs. A small bonus is that this program now supports retrieving tracking data, because it retrieves it from celestrack.com according to the new rules. A python script (or rather three) has been prepared for it, with which the signal on the input can be monitored in real time.
The available switches and their meanings:
HUNITY recorder for the PlutoSDR (Pluto+ single-buffer dual RX)
Usage: hunity_pluto_rx [-options]
-u URI context, such as "ip:pluto.local"
-F forced continuous recording, no Doppler correction
-i track the given satellite ID (default: 56957)
-f downlink frequency for sat (default: 437390000 Hz)
-8 output sample rate 200 ksps (default: 50 ksps)
-J output sample rate 100 ksps (default: 50 ksps)
-M output sample rate in ksps (default: 50 ksps)
-k download TLE data for default (or selected with -i) satellite from celestrak.com
-n download new satellites from celestrak.com
-a download actives from celestrak.com
-c download cubesats from celestrak.com
-K download TLE from this url
-s enable printing sat and signal statistics
-e elevation limit (default: 0 deg)
-g disable AGC, set manual gain to <value>
-A fast-attack AGC
-2 dump downconverted samples from RX2
-O dump downconverted samples to stdout
-Z dump downconverted samples to ZMQ PUB tcp://0.0.0.0:7207
-P real time samples to stdout
-D enable doppler correction for real time samples
-S enable printing initialization messages
-L enable turning antenna with ROTCTLD protocoll (default: false)
-o disable antenna overturn +-25 deg (default: enabled)
-N antenna zero point: North (default: South)
-R IP address of rotator for ROTCTLD
-r port number for ROTCTLD (default: 4533)
-d disable RX2
-h prints this help message
Most of the switches have the same meaning as the original, the changes are as follows:
-f - downlink frequency of satellite,
-F - records even if the selected satellite is not above the horizon (no doppler correction)
-k - orbit data of the satellite specified with the -i switch (or default)
-n - orbit data of the new satellites on orbit (orbital data of satellites launched in the last 30 days)
-a - orbit data of active satellites (orbital data of active satellites - long, are not recommended)
-c - orbit data for cubesat satellites
-s - its default state has changed - it is disabled by default, -s turns it on
-2 - this switch determines which receiver signal is sent to stdout or zmq - no switch: RX1, with -2: RX2
-O and -Z meaning unchanged, source depends on -2
-P - sends samples of the incoming signal directly to stdout instead of through the buffer - real-time display
-L - allow antenna rotation
-o - there is overrotation
-N - the zero point of the antenna. Default is south, this can be used to switch to north
-R - the IP number of the computer on which the rotctld server is running
-r - the port number of rotctld. Default is 4533
-d - disable the second receiver (only RX1 will be active)
P requires the O and Z switches to be inactive, so do not use them together with P, as they have priority over P.
The k, n, a, c switches are independent of each other, only one of them needs to be used. The list of active satellites is quite long, so it takes a long time to retrieve them. Use this switch only when absolutely necessary, and then not too often.
The output sampling frequency can be specified with the -8 -J switches, but can also be specified with the -M switch when the parameter after it determines the frequency. This can be 1, 100, 100000 for 100 ksps or 2, 200 or 200000 for 200 ksps.
Installation:
Follow the instructions here: https://gitlab.com/phorvath/smogcli2
Install all libraries and tools. If you want to be sure, install the entire package as described on the website. If the installation went through without errors, replace the 4 files in the src folder: ad936x_device.cpp, ad936x_device.hpp, hunity_pluto_rx.cpp and tle.cpp with the ones found in the zip. Since the date of these files is older than the one installed now, you need to open each file you just replaced, type a character in it, delete it and save it. This will update its date, so the make command will recompile it. If you are braver, you can replace the 4 files mentioned before compiling, then they will compile immediately, and you don't have to fiddle with them. It may throw an error during compilation. This means that your machine is missing some component, install it. If the smogcli2 package is already on your machine, then of course you just need to replace the 4 files mentioned and recompile the program. It is possible that fmt will be missing, in this case, the solution is: sudo apt install libfmt-dev. I recommend that you use the -s switch at first to see the initialization process.
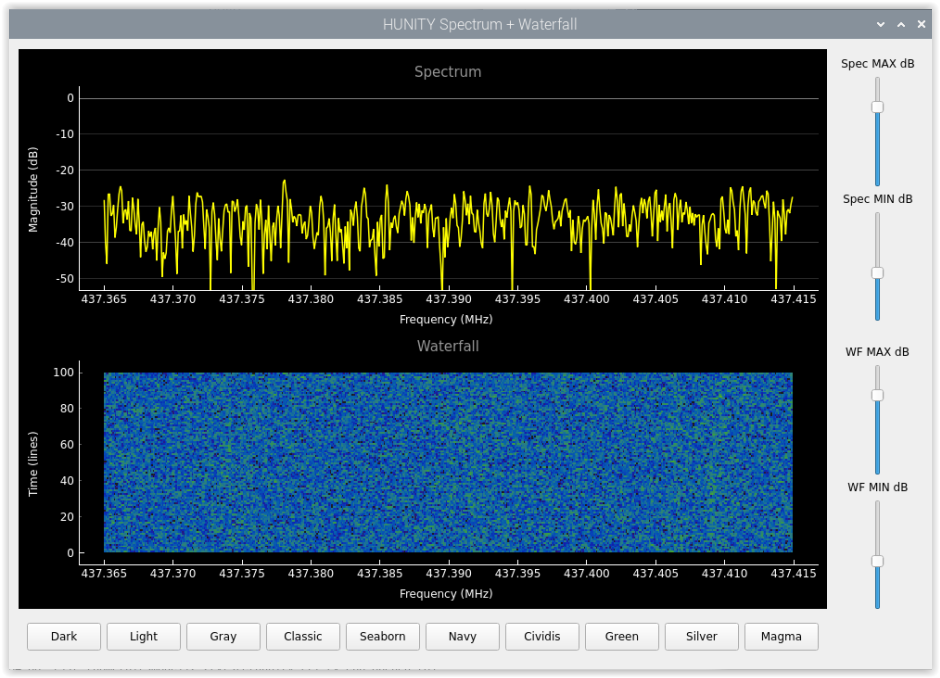
If the installation is successful, it can be used in the same way as the original 1-receiver version. If you want to see what is happening on the input, start it like this:
./hunity_pluto_rx -u ip:pluto.local -f 433920000 -i 35935 -g 71 -P | ./qtplot.py
or........... | ./liveplot.py (1-2 s delay)
the frequency is only 433920000 because there is always some signal on this frequency that you can test with (if there isn't, you are very lucky). The default frequency in the program is 437390000 Hz, so you don't need to set this. If you are not using the default frequency (you are tracking a different satellite), you can specify the frequency as a parameter to qtplot like this: qtplot.py -f 433920000. If you use the -8 switch in hunity_pluto_rx, you also need to specify the sampling frequency like this: qtplot.py -f 433920000 -s 200000. Without parameters, the frequency is 437390000 and the sample rate is 50000. By default, qtplot intentionally does not have doppler correction to give you more accurate information about the frequency of the incoming signal. If this bothers you, start hunity_pluto_rx with a -D switch. Then the samples coming with the P switch will also be Doppler corrected, but keep in mind that the frequency scale on the spectrum analyzer always shows the nominal frequency and not the momentary one.
Of course, the sat_id will have to be given based on the Hunity id.
To make this work, you first need to make the qtplot.py and liveplot.py scripts executable:
chmod +x qtplot.py
chmod +x liveplot.py
Of course, there may be components in the python script that you don't have installed, so install them in the appropriate way (the internet and chatGPT can help). It will probably look for the pyqtgraph library. Install it like this: sudo apt install python3-pyqtgraph
The advantage of the P switch and qtplot is that it displays the samples in real time. If you use the O switch, it will work the same way, but you have to take into account that in that case the samples come through the rather large buffer, so the delay is 65 - 90 seconds!
The advantage of using zmqplot.py is in that it can be run on another machine if properly configured. Of course, the high latency must be taken into account there as well. Zmqplot also has switches: -f frequency, -s sample rate, -p port, -a IP address where smogcli2 is running. When started without parameters, the frequency is: 437390000, sample rate: 50000, port: 7207 and IP: 127.0.0.1.
Depending on the noise floor of the receiver, it may be necessary to modify the values of the MAXDB and MINDB variables in liveplot so that the curves are displayed correctly. Zmqplot and qtplot try to optimize the values of MAXDB and MINDB for the incoming signal.
If you get an error message like this after starting: QStandardPaths: wrong permissions on runtime directory /run/user/1000, 0770 instead of 0700 then you need to issue this command: sudo chmod 700 /run/user/1000
Depending on the receiver noise floor, it may be necessary to modify the values of the MAXDB and MINDB variables in qtplot, liveplot, zmqplot so that the curves are displayed correctly.
The program can also perform antenna rotation via the rotctld protocol. To do this, you need to set the IP number of the machine on which the rotctld program is running. If necessary, the port number can also be set if the default port number 4533 does not work for some reason. Rotation must be enabled with the -L switch.
pluto_2rx
The development was done on a Raspberry Pi5. I tried it on a RPi4, and it worked. I haven't tried it on an older machine.